 | |||
|
Quantitative Fault Seal Analysis Fault seal behavior of normal faults in most hydrocarbon basins is dependent upon the ratio of sand/shale in the fault zone. Faults with sand-rich gouge tend to leak; faults with shale-rich gouge tend to seal. The estimated sand/shale ratio is the SGR, or SMEAR GOUGE RATIO. The SGR is calculated from the total thickness of sand and shale that has moved past a point along the fault. The SGR required for seal or leak is determined empirically by analyzing faults in existing fields. Our growing database now includes more than 400 faults and provides highly predictable control over seal behavior. In the Gulf Coast 97% of all faults analyzed obey this simple relationship between gouge composition and seal behavior. Calculation of SGR The diagram below shows how the SGR is calculated as a sand, Rd, moves along the fault with progressive throws of 10, 100, and 250 ft. In each case the SGR is equal to the thickness of sand divided by the thickness of shale that Rd has moved past. This stratigraphic interval that Rd has moved past is shown in red.
| This is a sample |
| |
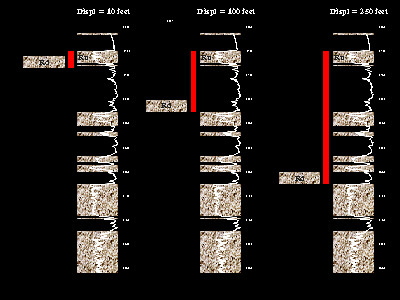 | ||||
| At a small throw of 10 ft Rd has moved past the same sand in the footwall, Ru, plus a small thickness of shale. The ratio of sand/shale in this red interval is the SGR. The SGR will be high since Rd has moved past a predominantly sand interval. As the throw increases to 100 ft Rd moves past a larger stratigraphic interval including Ru and the thick shale below it. Again the SGR is the ratio of sand/shale in this red interval. The SGR is lower since Rd has moved past more shale. With increasing throw (250 ft) Rd moves past successive sands and shales. The SGR changes. To see a plot of the SGR versus increasing displacement for this well see SGR-DISPL. Examples of SGR Displays There are several ways of displaying SGR data that are automatically produced by our SEALS software. An SGR-DISPL plot shows the variation in SGR and seal risk with increasing fault throw. A SGR-Displacement plot shows the variation in SGR at only a single point along the fault plane. An SGR LOG shows the variation in gouge composition along a line within the fault plane. SGR MAPS Calculation of SGR requires careful and methodical log analysis for sand/shale discrimination. TERRASCIENCE'S log analysis software is specifically designed for quantitative fault seal analysis. See RISK for a discussion of uncertainty.
| |||
| For further information or to schedule a SEALS course CONTACT
| |||